Apple's (NASDAQ: AAPL) share price recently hit an all-time high of $237, pushing its market capitalization to $3.6 trillion. Despite the high valuation, analysts remain optimistic about Apple's growth potential, particularly in the AI sector. Loop Capital Markets upgraded Apple to a ‘buy’ rating with a $300 price target, predicting the company as poised to dominate AI like it did with digital music and social media. Morgan Stanley also sees significant upside, forecasting a "mini upgrade cycle" driven by new AI features for iPhones and iPads. This optimism suggests there may still be room for Apple’s stock to grow.
APPLE – H2 Timeframe
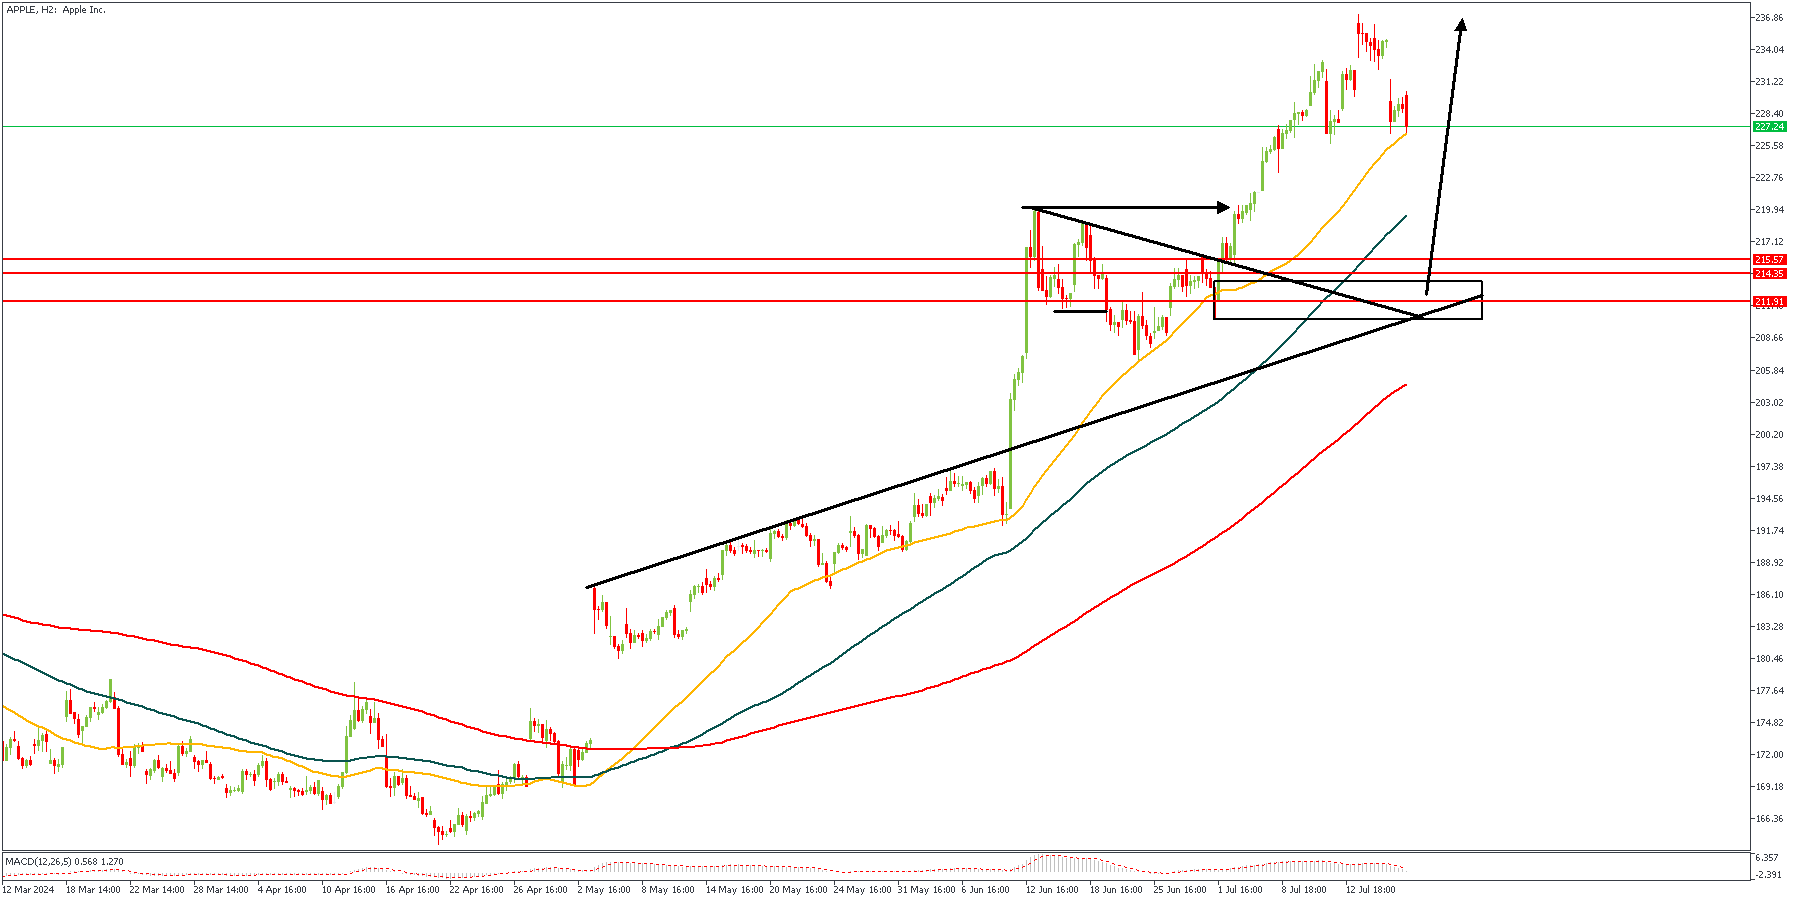
In line with the afore-mentioned analytical outlooks, the technical factors on the 2-hour timeframe chart seem to align perfectly in that direction. On the charts we see a confluence of support trendlines; bullish array of MAs 50, 100 and 200; a SBR price action pattern; and a drop-base-rally demand zone that’s nested within the key levels of the Fibonacci retracement tool.
Analyst’s Expectations:
Direction: Bullish
Target: 236.86
Invalidation: 206.50
TESLA – H1 Timeframe
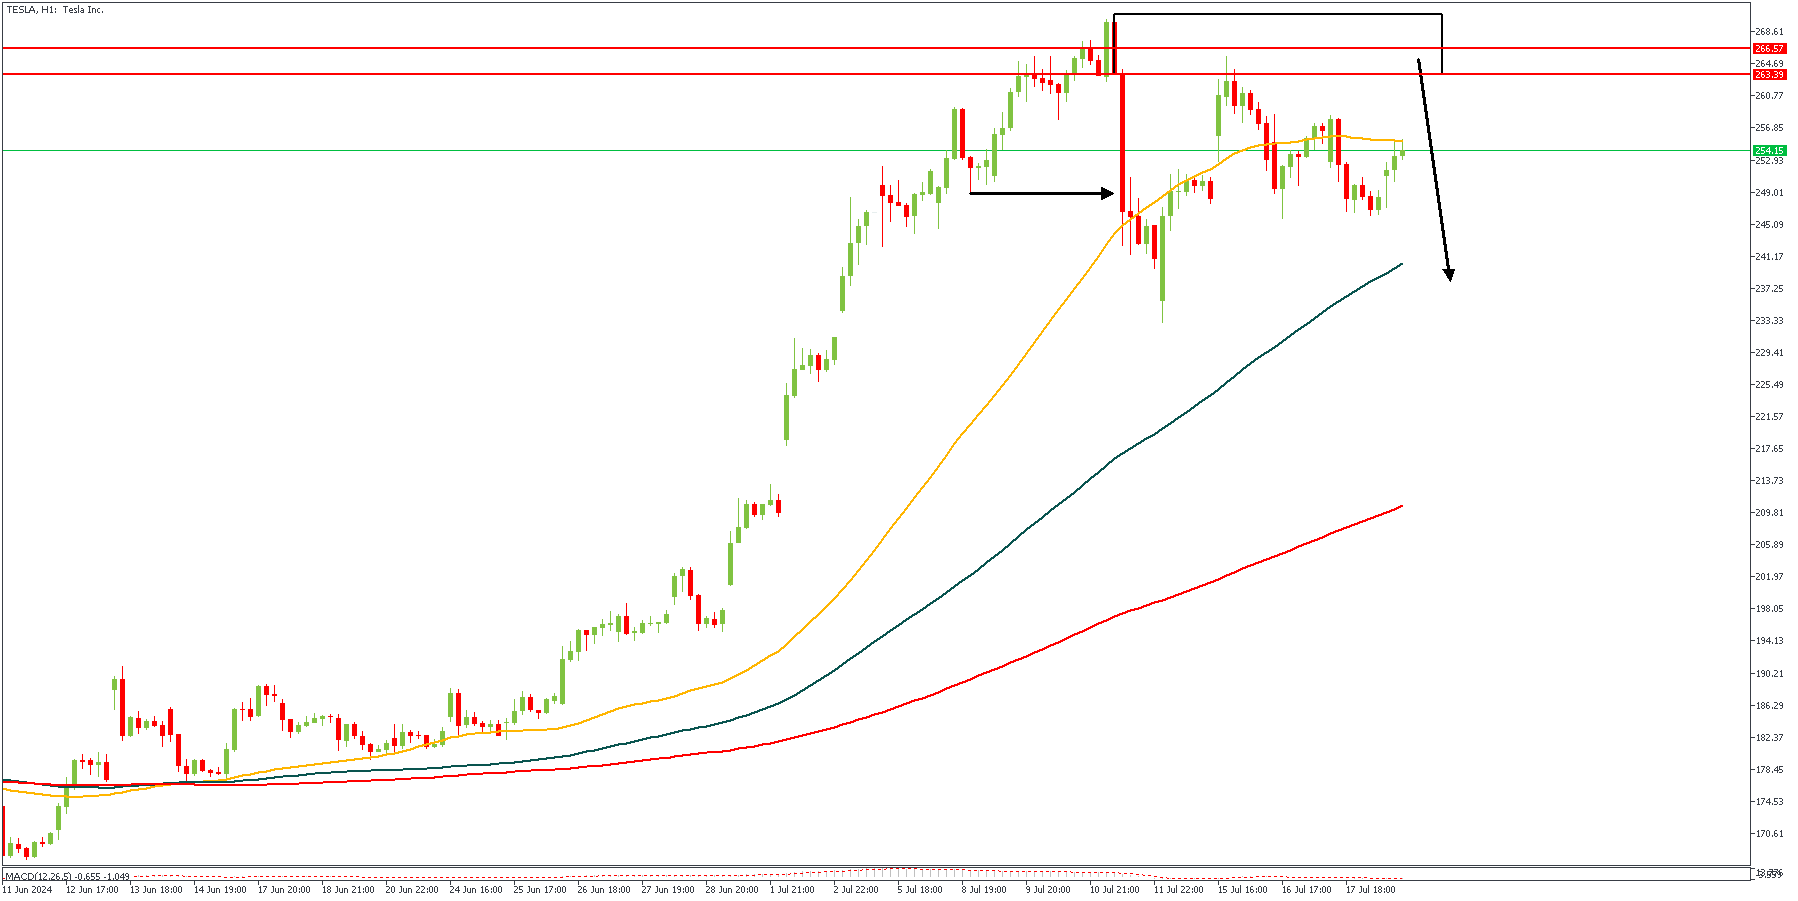
While the figures look favorable for Apple stock, Tesla stock prices may not share the same fate. The 1-hour timeframe chart of TESLA shows an initial rejection from a daily timeframe pivot zone (as shown by the red horizontal lines). The rejection can be seen to have broken below the previous low, thereby depicting a shift in the market structure, and perhaps a change altogether. I would like to see how price reacts to the retest of the supply zone though before concluding on the bearish sentiment in this case.
Analyst’s Expectations:
Direction: Bearish
Target: 235.65
Invalidation: 272.37
CONCLUSION
You can access more of such trade ideas and prompt market updates on the telegram channel.


